Table of Contents
Cryptocurrency trading is fast-paced and often unpredictable. Understanding Common trend Lines in Crypto trading is critical for making informed decisions and maximizing your profits. These trend lines and patterns act as a roadmap, offering insights into market movement, momentum, and potential turning points.
Whether you’re a beginner or an experienced trader, mastering trend lines is essential for navigating the dynamic world of crypto trading. Let’s explore the fundamentals and advanced strategies for trend lines.
What is a Trend Line?
A trend line is a straight line drawn on a price chart to represent the direction of an asset’s movement over time. It helps traders identify patterns, gauge market sentiment, and anticipate future price action.
There are two primary types of trend lines:
- Upward Trend Line: Indicates a bullish market where prices are consistently rising.
- Downward Trend Line: Signals a bearish market with declining prices.
Types of Trend Lines
Trend lines come in various forms, each with its own significance. Here are the most common types of trend lines:
- Support and Resistance Levels
- Support: The price level where demand is strong enough to prevent further declines.
- Resistance: The level where selling pressure halts upward momentum.
- Horizontal Lines
- Used to mark key support or resistance levels at fixed price points.
- Drawing Subjective Trend Lines
- Custom trend lines are drawn based on personal analysis and chart observations.
- Moving Averages
- Trend-following indicators that smooth price data over a specific period.
How to Draw Trend Lines?
Drawing trend lines accurately is an art and science. Follow these steps:
- Identify Key Points: Start by marking swing highs (peaks) and swing lows (valleys).
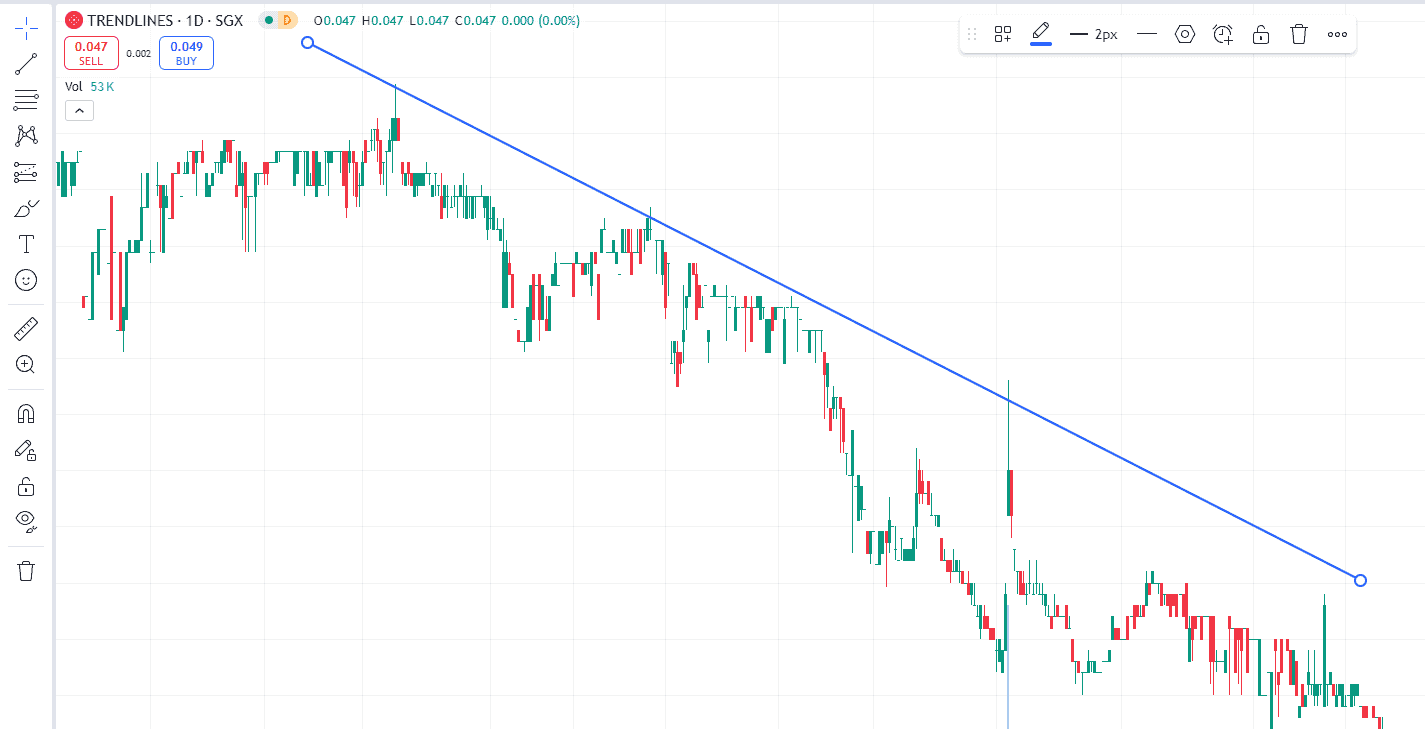
- Connect Points: For an upward trend, connect the lows. For a downward trend, connect the highs.
- Extend the Line: Project the line forward to anticipate future price movements.
- Adjust for Accuracy: Modify as new price data becomes available.
What Do Trend Lines Demonstrate?
Trend lines are more than just lines on a chart. They:
- Highlight market direction (uptrend, downtrend, or sideways).
- Indicate support and resistance zones.
- Reveal potential breakout or breakdown points.
- Provide a framework for identifying trade opportunities.
How to Identify Common trend Lines in Crypto trading?
To identify common trend Lines in Crypto trading effectively:
- Look for at least two points to connect (higher lows for uptrends, lower highs for downtrends).
- Use timeframes that match your trading style (e.g., daily charts for long-term trends).
- Validate with additional indicators like Relative Strength Index (RSI) or Volume Shifts.
Tips for Drawing Accurate Trend Lines
- Use clear pivot points.
- Avoid forcing trend lines to fit the chart.
- Combine with indicators like Bollinger Bands or Fibonacci Numbers.
- Validate lines with volume analysis (e.g., On-Balance Volume (OBV)).
Trendline Trading Strategy
A well-drawn trend line can serve as a powerful trading tool. Here’s how to use it:
A. Upward Trend Definition
An upward trend occurs when prices make higher highs and higher lows. Use this trend for buying opportunities.
B. Downward Trend Definition
A downward trend happens when prices make lower highs and lower lows. Ideal for short-selling strategies.
Advanced Techniques for Drawing Trend Lines
Take your trend line game to the next level with these techniques:
- Falling and Rising Wedges
- Falling wedge: A bullish reversal pattern.
- Rising wedge: A bearish continuation pattern.
- Divergence on Momentum Indicators
- Look for price trends diverging from momentum indicators like RSI or MACD.
- Head and Shoulders Pattern
- A reversal pattern signals the end of an uptrend.
- Cup and Handle
- A bullish continuation pattern resembling a cup followed by a small consolidation (handle).
Common Errors to Avoid in Trend Line Drawing
- Ignoring Timeframes: Use the right timeframe to avoid false signals.
- Forcing Lines: Trend lines should naturally align with price movements.
- Overcomplicating Charts: Keep your chart clean for better analysis.
- Ignoring Volume Shifts: Always pair trend lines with volume data.
Common trend Lines in Crypto trading
Understanding trend lines and patterns is essential for analyzing cryptocurrency markets. Below are some of the most popular and reliable common trend lines in crypto trading, grouped by their type and functionality:
1. Bullish Patterns
These patterns typically indicate upward momentum or the continuation of an existing bullish trend:
- Ascending Triangle
A bullish continuation pattern where the resistance line remains horizontal while the support line rises, indicating increasing buying pressure. - Bullish Rising Three
A continuation pattern in an uptrend, where smaller bearish candlesticks are surrounded by strong bullish candlesticks, suggesting bullish momentum. - Falling Wedge
A bullish reversal pattern where the price forms lower highs and lower lows, narrowing over time. Breakouts typically occur upwards. - Cup and Handle
A bullish continuation pattern resembling a teacup, where the price dips and then rises, followed by a smaller consolidation before a breakout. - Double Bottom
A reversal pattern where the price tests the same support level twice, indicating a strong bullish reversal.
2. Bearish Patterns
These patterns signal downward momentum or the continuation of an existing bearish trend:
- Bearish Engulfing Pattern
A candlestick pattern where a bearish candle engulfs the body of the previous bullish candle, signaling a potential reversal to the downside. - Bearish Flag
A continuation pattern in a downtrend, where the price consolidates briefly in a flag-like structure before resuming its bearish trajectory. - Rising Wedge
A bearish continuation pattern where the price forms higher highs and higher lows but converges, often breaking downwards. - Double Top
A reversal pattern where the price tests the same resistance level twice, signaling a strong bearish reversal. - Head and Shoulders
A classic reversal pattern indicates the exhaustion of an uptrend. It consists of three peaks, with the middle peak being the highest.
3. Neutral or Consolidation Patterns
These patterns indicate a pause in market momentum, where the price neither trends upward nor downward:
- Wedge
Represents consolidation. It can signal either a bullish or bearish breakout depending on the context and direction of the trend. - Pennant
A brief consolidation pattern marked by converging trend lines. It typically signals continuation in the direction of the prevailing trend. - Rectangle
A pattern where the price moves between horizontal support and resistance levels, signaling consolidation. - Sideways Trend
A lack of clear upward or downward momentum, often reflecting market indecision.
4. Key Indicators and Analytical Tools
These tools and levels are used to confirm trends, reversals, and momentum shifts:
- Relative Strength Index (RSI)
Measures the strength of price momentum on a scale of 0-100. An RSI above 70 indicates overbought conditions, while below 30 signals oversold conditions. - Bollinger Bands
A volatility indicator that uses a moving average and two standard deviation lines to identify overbought or oversold conditions. - Fibonacci Numbers
Used to identify key retracement and extension levels, which help predict potential support and resistance zones. - Moving Averages
Smoothed lines that show average prices over a specific time period, helping traders identify trends and reversals. Commonly used ones include the 50-day and 200-day moving averages. - On-Balance Volume (OBV)
Tracks the flow of volume to confirm trends. Rising OBV typically confirms upward momentum, while falling OBV indicates bearish momentum. - Divergence on Momentum Indicators
Occurs when price action diverges from momentum indicators (like RSI or MACD), signaling potential trend reversals.
5. Support and Resistance Levels
- Horizontal Lines
Mark key support and resistance levels, which are critical for identifying potential trend reversals or continuations. - Volume Shifts
Sudden changes in trading volume can validate trend breakouts or reversals, indicating the strength of market moves. - Drawing Subjective Trend Lines
Customized trend lines help traders design strategies based on specific patterns or price movements.
6. Continuation Patterns
These patterns signal the likelihood of a trend resuming after a brief pause:
- Flag
A small rectangular pattern represents a consolidation phase, followed by a breakout in the same direction as the prevailing trend. - Bullish Rising Three
Indicates a strong bullish continuation, where the price temporarily pauses before resuming its upward trajectory. - Pennant
Acts as a continuation pattern where the price consolidates into a triangle before breaking out in the trend’s direction.
7. Volatility and Confirmation Tools
- Bollinger Bands
A widely used tool to measure market volatility and identify overbought or oversold conditions. - Volume Shifts
Abrupt increases or decreases in trading volume are critical for confirming trend reversals or breakouts.
By leveraging these patterns and indicators, crypto traders can make informed decisions, identify potential opportunities, and manage risks effectively. Always pair technical analysis with sound risk management strategies for the best results.
Trend Line Trading Strategy
Using trend lines as part of your trading strategy can be highly effective. Here’s how:
- Trend Confirmation
- Use trend lines to identify the overall market direction. Enter trades in the direction of the trend for better odds.
- Breakout Trading
- Wait for the price to break above or below a trend line. Confirm breakouts with indicators like volume or RSI.
- Support and Resistance Levels
- Utilize trend lines to identify potential levels where the price may bounce or reverse.
- Combine with Indicators
- Pair trend lines with other tools like Bollinger Bands, Fibonacci retracements, or OBV for better accuracy.
Examples of Trend Line Patterns in Action
Ascending Triangle
- Example: Bitcoin often forms ascending triangles during bull runs, signaling continuation.
Double Bottom
- Example: Ethereum’s double bottom in 2020 marked the beginning of its bull market.
Head and Shoulders
- Example: XRP formed a head and shoulders pattern before its significant drop in 2021.
Frequently Asked Questions (FAQ)
1. How do you find common trend lines in crypto trading?
Look for higher highs and higher lows in uptrends or lower highs and lower lows in downtrends. Use tools like RSI and Bollinger Bands for confirmation.
2. How do you see trends in crypto?
Analyze charts using trend lines, moving averages, and volume data to identify market direction.
3. How do you read trend lines?
Identify two or more points to connect. Upward trend lines connect lows, while downward trend lines connect highs.
4. What are the trend indicators for crypto?
Common indicators include RSI, Bollinger Bands, Fibonacci Numbers, and Moving Averages.
5. How to draw trend lines in crypto?
Mark pivot points (highs/lows), connect them with a straight line and extend the line to project future price movements.
6. Most common trend lines to look for in crypto?
Support and resistance levels, ascending triangles, wedges, and moving averages are the most commonly used trend lines in crypto trading.
Conclusion
Mastering common trend lines in crypto trading is key to understanding market movements. Patterns like ascending triangles, wedges, and double tops help identify trends, potential reversals, and entry/exit points. Combining these tools with indicators like RSI or Moving Averages enhances accuracy, giving traders a competitive edge in the ever-volatile crypto market.

Prasanth is an experienced crypto trader and writer with 5 years of expertise in blockchain technology, cryptocurrency markets, and trading strategies. He specializes in creating insightful, easy-to-understand content that helps readers stay informed about the latest trends, investment opportunities, and security best practices in the crypto space. With a deep passion for digital assets and a commitment to providing valuable, trustworthy information, Prasanth empowers both beginners and experienced traders to make informed decisions in the fast-evolving world of cryptocurrency.